Solar Follow-up

Cyberpunk solar panels on a rooftop, courtesy of Neural.love.
I’ve been asked TONS of questions since I’ve published my original solar series of blog posts. A big one involves kilowatt hours (kWh), specifically the numbers, and how solar has impacted them. Since the answer is a little more detailed, I decided another blog post would be best.
Starting Point
I pulled some numbers from Energysage (not an endorsement, for me a data reference) to help establish a few baselines. In December of 2022, on average for the entire state of Texas the consumer cost of electricity is $0.13 per kWh. Frankly this seems low as there are reports of prices rising and Energysage might not reflect the higher prices, however for the sake of demonstration we’ll go with $0.13 per kWh). An average Texas home uses about 1351 kWh used per month, which works out to 16212 kWh per household, or $2107.56 annually (this does not necessarily include additional fees and taxes, potential late charges, etc). By Texas standards, my square footage is about average, so let's compare.
Bear in mind that in my pre-solar household in 2016 the usage for that year was 13680 kWh (yes, records were and are being kept). And again, the Energysage 16212 kWh per household number is from 2022, and I don’t have Energysage numbers from 2016 for a comparison. Instead I’ll just show my numbers pre- and post-solar panels. For more evenness, I’ll be showing only full years with a specific number of panels.
Panels Installed
In 2018, the first full year after the initial 22 solar panels were installed, they would supplement the power coming from the grid with power coming from the sun, and lowered the amount of kWh pulled down from the grid. So 2018, usage was 10517 kWh for the year, which was a considerable drop.
In 2019 the additional 24 panels were added for a total of 46, and in 2020 and 2021 the amount was around 9055 kWh for each of those years. Here is the interesting part, this is mainly usage when the sun is down or behind clouds (although usually on cloudy days there is some power getting through to the panels). So let's chart this out:
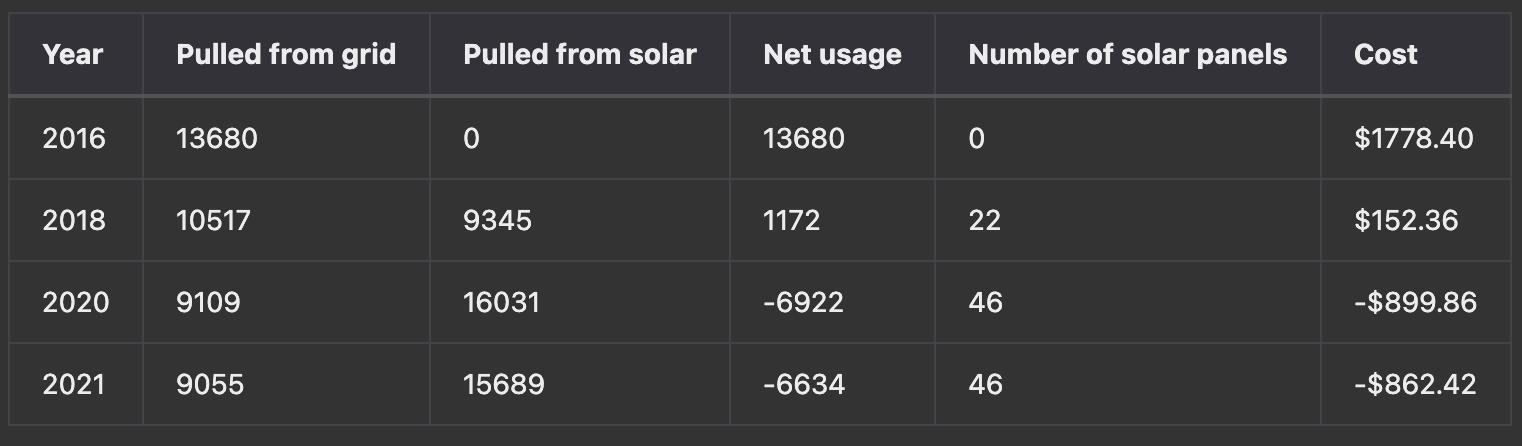
Note: The cost of charges from the grid is based upon an average rate of $0.13 per kWh based upon data from 2022, not previous years.
In general, with taxes and fees the electric bill for all of 2016 totaled close to $2000. That means for 2018, my first full year with 22 panels, I paid roughly $1850 less. My original 22 panels have paid for themselves at this point, the additional 24 panels will have paid for themselves in just a couple of years.
Battery Time
The "cap" was implemented this year. The cap is different from what is known as net metering. Net metering is the power company allowing credit off of your electric bill for the excess load from solar panels being put onto the grid by one’s solar setup. A “cap” means I cannot get credit for excess load that exceeds what I pull down for any given day. Green Mountain (my power company) was one of the last power companies in Texas to finally start doing this “cap.” For example, if in one month I pull down 750 kWh of power from the grid and upload 1250 kWh, I only get credit off my bill for 750 kWh, reducing my bill to just the taxes, grid delivery fees, and whatnot that apply to the amount I pulled down. This is one of two reasons for my current battery setup.
The first and most obvious reason is that in case the grid goes down, I still have power. I have not had an extended outage since acquiring the batteries, the one outage that lasted longer than a light flicker has been about 3 hours and it happened during the day with sunshine so the impact was barely noticeable, but if there is another event like the winter storm in 2021 I should be fine.
The second reason is that I can offset peak hour grid usage, and lower my overall consumption from the grid.
Evening Offset Mode
The system is configured for the solar panels to handle the load of the house as the main priority. If there is not enough juice coming from the panels, power is pulled down from the grid. However on a sunny day there is more than enough power from the panels to handle the load, and excess is used to charge the batteries. Once the batteries are charged to 100%, excess is then uploaded to the grid for credit against the amount I've pulled down. Starting at 5pm, if the panels are not producing enough power to handle the load, the system pulls juice from the batteries instead of the grid until the batteries reach 50%. If there was a full charge to 100% this can easily last until 11pm which is roughly when I head to bed. So during the evening hours when I am cooking dinner and have the most lights on, there is no load being pulled down from the grid, it pulls from the batteries instead. In addition many power companies usually have their rates highest during this time, so if there are any fees where I might have to pay, it’s for power I’ve pulled down during off-peak hours.
Here’s an example from my birthday where export of excess power to the grid import power from the grid. Starting at 5pm the load was being fed by the batteries until around 11pm when I was heading to bed. This is typical for a day with full sunshine:
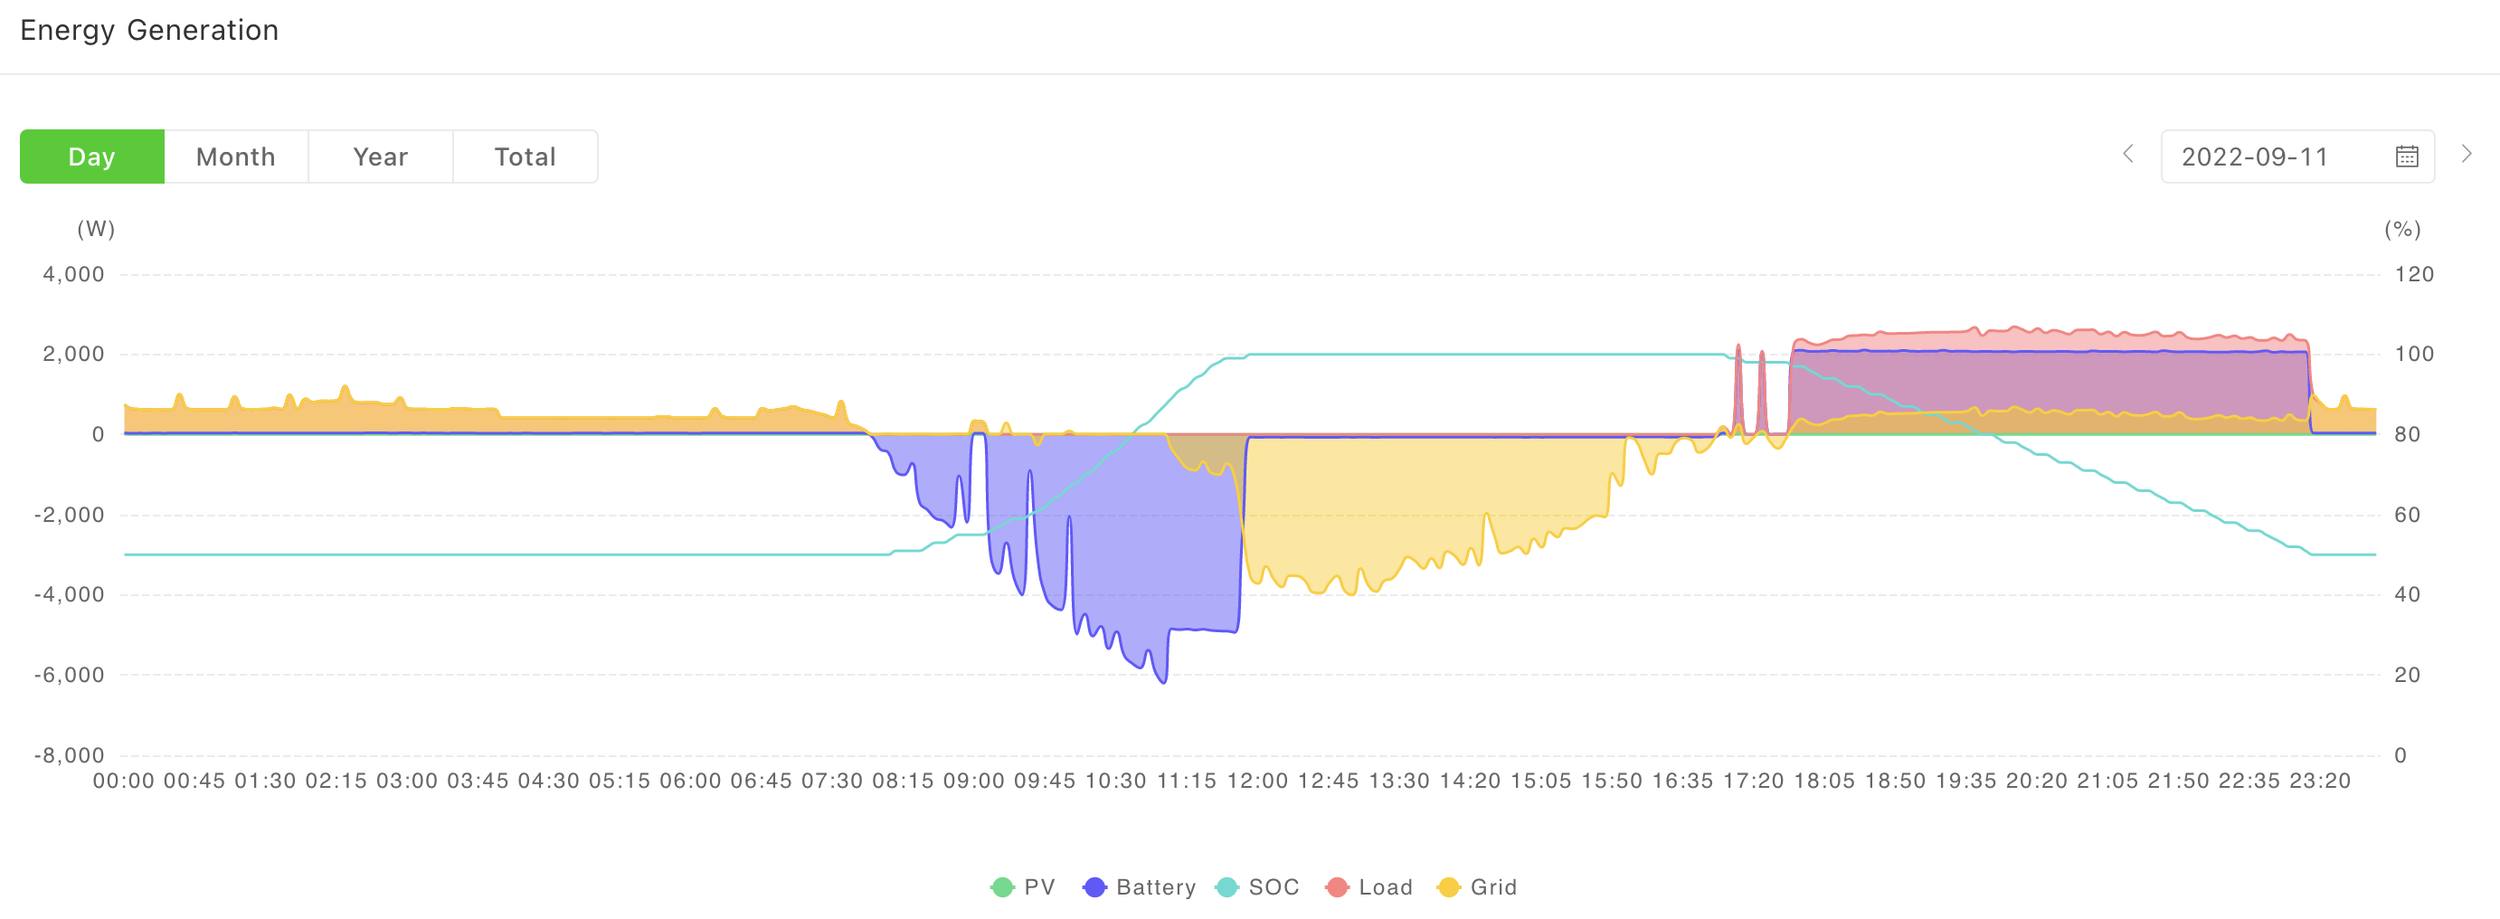
The light blue line is the battery level, starting at 50% from midnight until 8am, 100% from around noon until 5pm, and back to 50% around 11pm. This is considered a “good day” in kWh usage terms.
You might be wondering why only pull from the batteries until they reach 50%. In the case of an overnight grid outage, I have enough power to last all night and into the next morning. Does a lack of sunlight on a cloudy day impact things? Absolutely. But bear in mind there are on average 232 days in a year with sunshine in this part of Texas so most of the time this works out fine, and the panels do product some power even on cloudy days. It is not unusual for the batteries to reach a charge level of 60-65% on a cloudy day - that’s how effective the solar panels are.
And in case you are wondering where that excess power goes that I upload to the grid, it is used by other customers in my immediate area. So I am helping myself as well as my local community.
Offset Savings
The last thing to consider is that if I am on batteries during peak hours, I am using less grid power overall. I've only had the batteries since late August, but for September through November I saw less kWh usage from the grid:

Numbers are kWh pulled from the grid. November 2022 was 10% colder than November 2021, but still less grid usage despite more furnace blowing time for the extra heat.
I’m still not paying an electric bill as I had amassed a sizable credit with my electric company Green Mountain starting in April 2019 (when the number of panels were increased to 46) and ending with the cap in June of this year. For example, my electric bill for October 2022 knocked $29.19 off of my credited total. Based on my total kWh usage for October between both grid and solar which was 1142 kWh, my daily grid usage was 11 kWh in 2022 vs 23 kWh in 2021. These numbers will look even better when Spring arrives, and with more sunny days than not (this October had a fair amount of cloud cover) this is looking good, even with the cap on credit for exporting power to the grid.
Summary
It varies month to month, and for this blog post I am assuming $0.13 per kWh so I can compare month to month and year to year, so time will tell. 2023 will be the first full year with solar panels, batteries, and I am looking forward to seeing how well things go.